 The University of Texas at El Paso’s Minority AIDS Research Center (MARC) is the subrecipient of a $1 million implementation grant to target substance use disorders and opioid use disorders in five rural counties along the Texas-Mexico border.
Category: Uncategorized
Abandoned Buildings, Fear of Calling Police Contribute to High Rate of Fatal Overdoses in Philadelphia, New Study Shows
Abandoned Buildings, Fear of Calling Police Contribute to High Rate of Fatal Overdoses in Philadelphia, New Study Shows
How do you clean up clingy space dust? Zap it with an electron beam
The NASA Artemis missions aim to send astronauts to the moon by 2024. But to succeed, they’ll need to solve big problems caused by some tiny particles: dust.
Impacts on the moon’s surface have crushed lunar rock into dust over billions of years (SN: 1/17/19). The resulting particles are like “broken shards of glass,” says Mihály Horányi, a physicist at the University of Colorado Boulder. This abrasive material can damage equipment and even harm astronauts’ health if inhaled (SN: 12/3/13). Making matters worse, the sun’s radiation gives moon dust an electric charge, so it sticks to everything.
Horányi and colleagues have discovered a new method for combatting lunar dust’s static cling, using a low-powered electron beam to make dust particles fly off surfaces. It complements existing approaches to the sticky problem, the researchers report online August 8 in Acta Astronautica.
During the Apollo missions, astronauts relied on a low-tech system to clean lunar dust off their spacesuits: brushes. Such mechanical methods, however, are thwarted by the electrically charged nature of lunar dust, which clings to the nooks and crannies of woven spacesuit fabric.
The newly described method takes advantage of the dust’s electrical properties. An electron beam causes dust to release electrons into the tiny spaces between particles. Some of these negatively charged electrons are absorbed by surrounding dust specks. Because the charged particles repel each other, the resulting electric field “ejects dust off the surface,” says Xu Wang, a physicist also at the University of Colorado Boulder.
“This is a very unique idea,” says mechanical engineer Hiroyuki Kawamoto of Waseda University in Tokyo, who was not involved in the new work. Kawamoto and colleagues have developed their own dust-busting technologies, including a layer of electrodes that can be built into materials. When embedded in a spacesuit or on the surface of equipment, the electrodes generate electrostatic forces and fling away charged dust particles. Such systems are more complex than shooting an electron beam at surfaces, Wang says. But a potential downside to the simpler electric beam idea, Kawamoto says, is that it would require a robot or some other external means to direct it.
Another limitation of the electron beam is that it left behind 15 to 25 percent of dust particles. The researchers aim to improve the cleaning power. The team also envisions the electron beam as one of multiple approaches that future space explorers will take to keep surfaces clean, Horányi says, in addition to suit design, other cleaning technologies and, one day, even lunar habitats with moon dust mudrooms.
Virtual Reality Trains Public to Reverse Opioid Overdoses
The United States has seen a 200% increase in the rate of deaths by opioid overdose in the last 20 years. But many of these deaths were preventable. Naloxone, also called Narcan, is a prescription drug that reverses opioid overdoses, and in more than 40 states — including Pennsylvania — there is a standing order policy, which makes it available to anyone, without an individual prescription from a healthcare provider.
Phosphine gas found in Venus’ atmosphere may be ‘a possible sign of life’
Venus’ clouds appear to contain a smelly, toxic gas that could be produced by bacteria, a new study suggests.
Chemical signs of the gas phosphine have been spotted in observations of the Venusian atmosphere, researchers report September 14 in Nature Astronomy. Examining the atmosphere in millimeter wavelengths of light showed that the planet’s clouds appear to contain up to 20 parts per billion of phosphine — enough that something must be actively producing it, the researchers say.
If the discovery holds up, and if no other explanations for the gas are found, then the hellish planet next door could be the first to yield signs of extraterrestrial life — though those are very big ifs.
“We’re not saying it’s life,” says astronomer Jane Greaves of Cardiff University in Wales. “We’re saying it’s a possible sign of life.”
Venus has roughly the same mass and size as Earth, so, from far away, the neighboring planet might look like a habitable world (SN: 10/4/19). But up close, Venus is a scorching hellscape with sulfuric acid rain and crushing atmospheric pressures.
Still, Venus might have been more hospitable in the recent past (SN: 8/26/16). And the current harsh conditions haven’t stopped astrobiologists from speculating about niches on Venus where present-day life could hang on, such as the temperate cloud decks.
“Fifty kilometers above the surface of Venus, the conditions are what you would find if you walk out of your door right now,” at least in terms of atmospheric pressure and temperature, says planetary scientist Sanjay Limaye of the University of Wisconsin–Madison, who was not involved in the new study. The chemistry is alien, but “that’s a hospitable environment for life.”
Previous work led by astrochemist Clara Sousa-Silva at MIT suggested that phosphine could be a promising biosignature, a chemical signature of life that can be detected in the atmospheres of other planets using Earth-based or space telescopes.
On Earth, phosphine is associated with microbes or industrial activity — although that doesn’t mean it’s pleasant. “It’s a horrific molecule. It’s terrifying,” Sousa-Silva says. For most Earthly life, phosphine is poisonous because “it interferes with oxygen metabolism in a variety of macabre ways.” For anaerobic life, which does not use oxygen, “phosphine is not so evil,” Sousa-Silva says. Anaerobic microbes living in such places as sewage, swamps and the intestinal tracts of animals from penguins to people are the only known life-forms on Earth that produce the molecule.
Still, when Greaves and colleagues searched Venus’ skies for signs of phosphine, the researchers didn’t expect to actually find any. Greaves looked at Venus with the James Clerk Maxwell Telescope in Hawaii over five mornings in June 2017, aiming to set a detectability benchmark for future studies seeking the gas in the atmospheres of exoplanets (SN: 5/4/20), but was startled to find the hints of phosphine. “That’s a complete surprise,” Greaves says. When she was analyzing the observations, “I thought ‘Oh, I must have done it wrong.’”

So the team checked again with a more powerful telescope, the Atacama Large Millimeter/submillimeter Array in Chile, in March 2019. But the signature of phosphine — seen as a dip in the spectrum of light at about 1.12 millimeters — was still there. The gas absorbs light in that wavelength. Some other molecules also absorb light near that wavelength, but those either couldn’t explain the whole signal or seemed improbable, Greaves says. “One of those is a plastic,” she says. “I think a floating plastic factory is a less plausible explanation than just saying there’s phosphine.”
Phosphine takes a fair amount of energy to create and is easily destroyed by sunlight or sulfuric acid, which is found in Venus’ atmosphere. So if the gas was produced a long time ago, it shouldn’t still be detectable. “There has to be a source,” Greaves says.
Greaves, Sousa-Silva and colleagues considered every explanation they could think of apart from life: atmospheric chemistry; ground and subsurface chemistry; volcanoes outgassing phosphine from the Venusian interior; meteorites peppering the atmosphere with phosphine from the outside; lightning; solar wind; tectonic plates sliding against each other. Some of those processes could produce trace amounts of phosphine, the team found, but orders of magnitude less than the team detected.
“We’re at the end of our rope,” Sousa-Silva says. She hopes other scientists will come up with other explanations. “I’m curious what kind of exotic geochemistry people will come up with to explain this abiotically.”
The idea of searching for life on Venus “has been regarded as a pretty out-there concept,” says Planetary Science Institute astrobiologist David Grinspoon, who is based in Washington, D.C. Grinspoon has been publishing about the prospects for life on Venus since 1997, but was not involved in the new discovery.
“So now I hear about this, and I’m delighted,” he says. “Not because I want to declare victory and say this is definite evidence of life on Venus. It’s not. But it’s an intriguing signature that could be a sign of life on Venus. And it obligates us to go investigate further.”
Because of the planet’s acidic atmosphere, extreme pressures and lead-melting temperatures, sending spacecraft to Venus is a challenge (SN: 2/13/18). But several space agencies are considering missions that could fly in the next few decades.
In the meantime, Greaves and colleagues want to confirm the new phosphine detection in other wavelengths of light. Observations they had planned for the spring were put on hold by the coronavirus pandemic. And now, Venus is in a part of its orbit where it’s on the other side of the sun.
“Maybe when Venus comes around on the other side of the sun again,” Greaves says, “things will be better for us here on Earth.”
Potent Drug Supply Drop, Not U.S. Domestic Drug Policies, Likely Behind 2018’s Overdose Death Downturn
The slight decline in drug overdose deaths in 2018 coincides with Chinese regulations on the powerful opioid carfentanil, rather than the result of domestic U.S. efforts to curb the opioid epidemic, a University of Pittsburgh Graduate School of Public Health analysis revealed today.
University of Miami Miller School Researcher Wins NIH Avenir Award to Pursue Innovative Opioid Addiction Research
Luis M. Tuesta, Ph.D., assistant professor in the Department of Psychiatry and Behavioral Sciences at the University of Miami Miller School of Medicine, has been awarded the Avenir Award from the National Institute on Drug Abuse, part of the National Institutes of Health, to study the epigenetic mechanisms of microglial activation and their role in shaping the behavioral course of opioid use disorder.
Dark matter clumps in galaxy clusters bend light surprisingly well
Dark matter just got even more puzzling.
This unidentified stuff, which makes up most of the mass in the cosmos, is invisible but detectable by the way it gravitationally tugs on objects like stars. (SN: 11/25/19). Dark matter’s gravity can also bend light traveling from distant galaxies to Earth — but now some of this mysterious substance appears to be bending light more than it’s supposed to. A surprising number of dark matter clumps in distant clusters of galaxies severely warp background light from other objects, researchers report in the Sept. 11 Science.
This finding suggests that these clumps of dark matter, in which individual galaxies are embedded, are denser than expected. And that could mean one of two things: Either the computer simulations that researchers use to predict galaxy cluster behavior are wrong, or cosmologists’ understanding of dark matter is.
Very high concentrations of dark matter can act like a lens to bend light and drastically alter the appearance of background galaxies as seen from Earth — stretching them into arcs or splitting them into multiple images of the same object on the sky. “It’s totally cool. It’s like a fun house mirror,” says astrophysicist Priyamvada Natarajan of Yale University.
Judging by computer simulations of galaxy clusters, clumps of dark matter around individual galaxies that are dense enough to cause such dramatic gravitational lensing effects should be rare (SN: 10/4/15). Based on cluster simulations run by Natarajan and colleagues, “we would expect to see 1 [strong lensing] event in every 10 clusters or so,” says study coauthor Massimo Meneghetti, an astrophysicist at the Astrophysics and Space Science Observatory of Bologna in Italy.
But telescope images told a different story. The researchers used observations from the Hubble Space Telescope and the Very Large Telescope in Chile to investigate 11 galaxy clusters from about 2.8 billion to 5.6 billion light-years away. In that set, the team identified 13 cases of severe gravitational lensing by dark matter clumps around individual galaxies. These observations indicate there are more high-density dark matter clumps in real galaxy clusters than in simulated ones, Meneghetti says.
The simulations could be missing some physics that leads dark matter in galaxy clusters to glom tightly together, Natarajan says. “Or … there’s something fundamentally off about our assumptions about the nature of dark matter,” she says, like the notion that gravity is the only attractive force that dark matter feels.
Richard Ellis, a cosmologist at the University College London who was not involved in the work, thinks the crux of the problem is more likely in the computer simulations than in the nature of dark matter. “A cluster of galaxies is a very dangerous place. It’s like the Manhattan of the universe,” he says — busy with galaxies whizzing past one another, colliding and getting torn up. “There’s awful physics that goes into predicting how many of these little lensed things they should find,” Ellis says, so the new result “is intriguing, but my suspicion is that there’s something in the simulations … that isn’t quite right.”
Future observations with the upcoming Euclid space telescope (SN: 11/14/17), the Nancy Grace Roman Space Telescope and Vera C. Rubin Observatory (SN: 1/10/20) could help clear matters up, says Bhuvnesh Jain, an astrophysicist at the University of Pennsylvania who was not involved in the work. “These three telescopes are going to produce extremely large samples of galaxy clusters,” he says. That may lead to a new understanding of the physics in these turbulent environments, and help determine whether unrealistic simulations are to blame for this dark matter mystery.
How does a crop’s environment shape a food’s smell and taste?
About seven years ago, Kristin and Josh Mohagen were honeymooning in Napa Valley in California, when they smelled something surprising in their glasses of Cabernet Sauvignon: green pepper. A vintner explained that the grapes in that bottle had ripened on a hillside alongside a field of green peppers. “That was my first experience with terroir,” Josh Mohagen says.
It made an impression. Inspired by their time in Napa, the Mohagens returned home to Fergus Falls, Minn., and launched a chocolate business based on the principle of terroir, often defined as “sense of place.”
Different countries produce cocoa with distinct flavors and aromas, Kristin Mohagen says. Cocoa from Madagascar “has a really bright berry flavor, maybe raspberry, maybe citrus,” she says, while cocoa from the Dominican Republic “has a little more nutty, chocolaty taste.”
The couple estimates that back in 2013, when they founded Terroir Chocolate, about 50 other small batch chocolate companies in the United States were also touting terroir as integral to their products’ flavors.
Since then, terroir has continued to take hold as a marketing strategy — and not just for wine and chocolate. Terroir labels are also becoming more common for products like coffee, tea and craft beer, says Miguel Gómez, an economist at Cornell University who studies food marketing and distribution. Consumers “are increasingly interested in knowing where the products they are eating are produced — not only where but who is making them and how,” he says. People “value differences in the aromas, the flavors.”
The definition of terroir is somewhat fluid. Wine enthusiasts use the French term to describe the environmental conditions in which a grape is grown that give a wine its unique flavor. The soil, climate and even the orientation of a hillside or the company of neighboring plants, insects and microbes play a role. Some experts expand terroir to include specific cultural practices for growing and processing grapes that could also influence flavor.
The notion of terroir is quite old. In the Middle Ages, Cistercian and Benedictine monks in Burgundy, France, divided the countryside into climats, according to subtle differences in the landscape that seemed to translate into unique wine characteristics. Wines produced around the village of Gevrey-Chambertin, for example, “are famous for being fuller-bodied, powerful and more tannic than most,” says sommelier Joe Quinn, wine director of The Red Hen, a restaurant in Washington, D.C. “In contrast, the wines from the village of Chambolle-Musigny, just a few miles south, are widely considered to be more fine, delicate and light-bodied.”
Some scientists and wine experts are skeptical that place actually leaves a lasting imprint on taste. But a recent wave of scientific research suggests that the environment and production practices can, in fact, impart a chemical or microbial signature so distinctive that scientists can use the signature to trace food back to its origin. And in some cases, these techniques are beginning to offer clues on how terroir can shape the aroma and flavor of food and drink.
Coffee’s chemical fingerprint
Ecologist Jim Ehleringer of the University of Utah in Salt Lake City studies trace elements that plants passively take up. Those elements are a direct reflection of the soil. “Trace elements do not decay and so they become characteristic of a soil type and persist over time,” Ehleringer says.
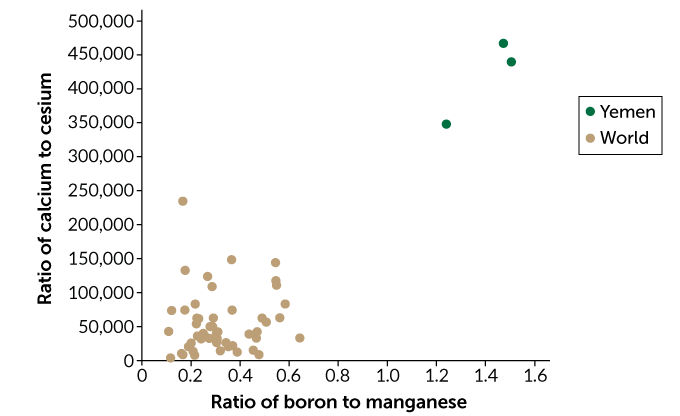
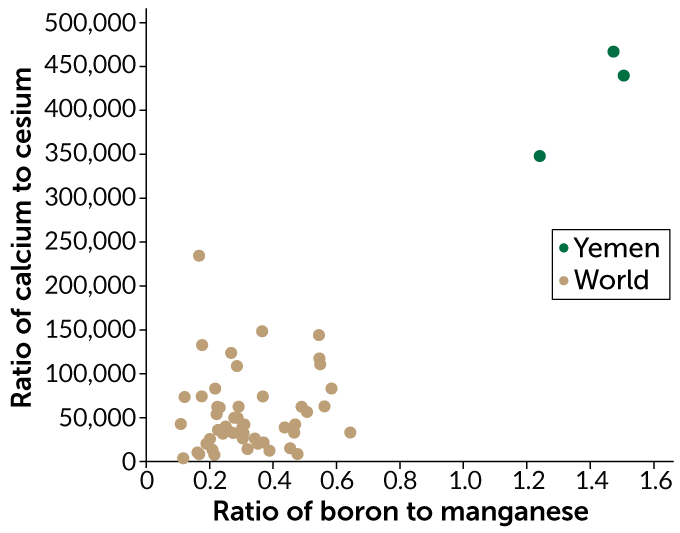
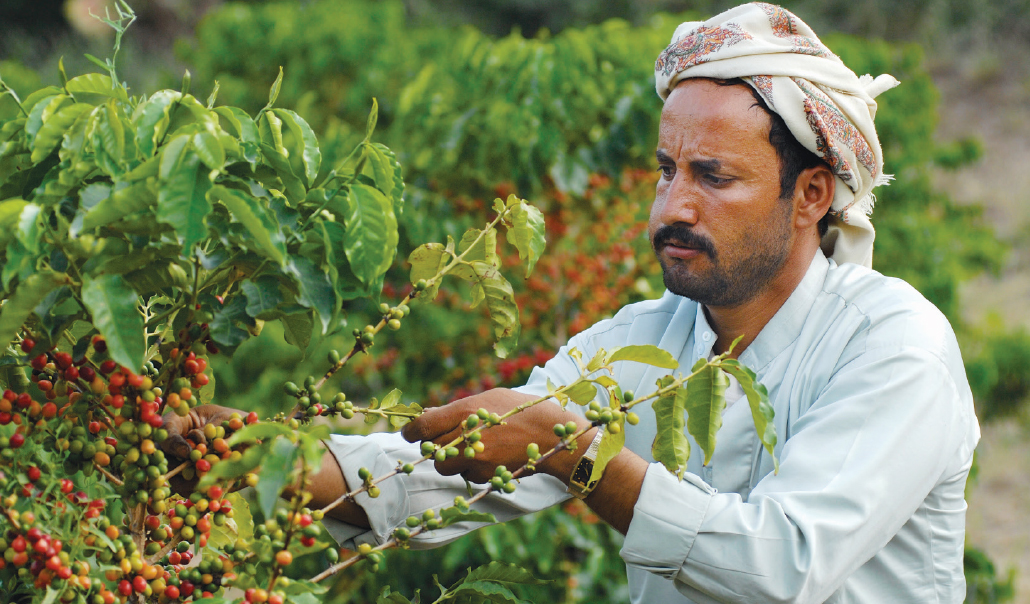
To see if they could trace a coffee to its origin using the coffee’s blend of trace elements, Ehleringer and his team recently measured the concentrations of about 40 trace elements in more than four dozen samples of roasted arabica coffee beans from 21 countries. Roasting beans to different temperatures can affect the concentrations of individual elements. To correct for this roasting effect, Ehleringer calculated the ratio of each element to every other element in a sample, which remains fairly constant, even with roasting.
In the Aug. 1 issue of Food Chemistry, his team reports that coffee beans from different regions can have distinct chemical fingerprints. A coffee’s chemical quality “comes down to geology,” Ehleringer says. Three samples of coffee beans from Yemen, for example, had a ratio of boron to manganese that was shared by less than 0.5 percent of coffee samples grown elsewhere.
Other researchers have used similar elemental analyses to find chemical signatures of place in products ranging from wines produced in distinct growing regions in Portugal to peanuts grown in different provinces in China.
The technique is valuable for validating origin when terroir is part of a product’s allure. Coffee farmers in Kona on Hawaii’s Big Island, for example, are using the results of an elemental analysis to support a class action lawsuit, scheduled for trial in November, against 21 major retailers. The suit claims those companies falsely market their coffees as “Kona” when the beans were actually grown elsewhere.
While an elemental analysis can authenticate a product’s terroir, it does not suggest that geology shapes flavor. Trace elements alone, says Ehleringer, “impart no flavor or taste.”
Tracking cocoa to its source
To try to link flavor to place, some scientists go after different chemical signatures altogether. At Towson University in Maryland, chemist Shannon Stitzel is tracing cocoa to its roots using organic compounds, which are mostly produced by the cocoa plant itself. The concentration of specific organic compounds in a plant can result from a complex mix of interacting factors — from the genes of a particular variety to components of terroir like climate and agricultural practices.
Stitzel works with samples of cocoa liquor — cocoa beans that have been fermented, dried, roasted and ground into a paste — from across the globe. At room temperature, cocoa liquor is a solid. But with a bit of heat, the paste melts into a glossy liquid that Stitzel describes as “a little thicker than honey.”
Using organic compounds to assign the cocoa liquor samples to their countries of origin is “not nearly as clean as when you do it with elemental analysis,” she says. In unpublished work, she was able to use an elemental analysis to accurately link cocoa liquor to its country of origin about 97 percent of the time.
But Stitzel turned to organic compounds because their presence may ultimately help explain the flavor differences that she, like the Mohagens, thinks very clearly exist between cocoa liquors from different countries. “You can open up each of the containers and the aroma is entirely different,” she says.
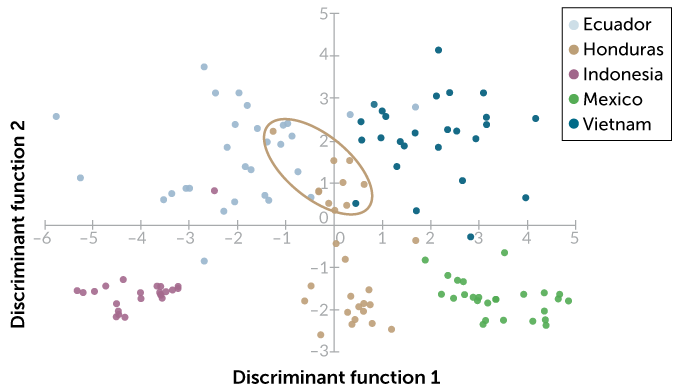
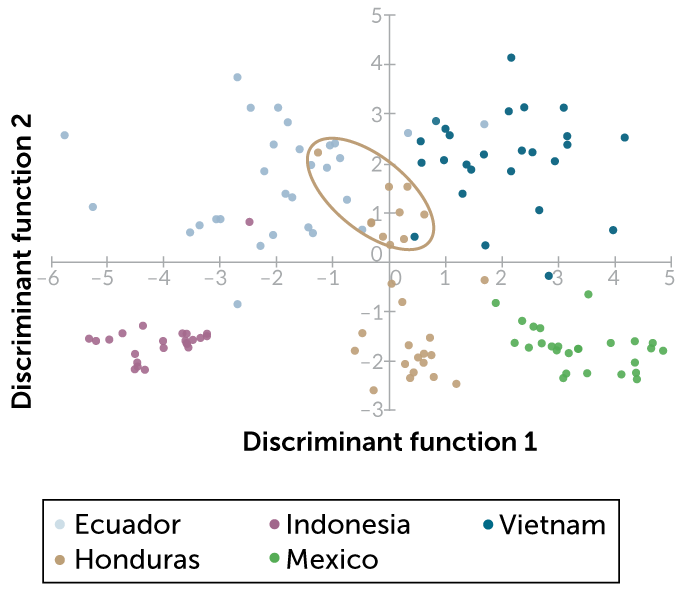
Stitzel recently identified concentrations of organic compounds in cocoa liquor from Vietnam, Indonesia, Honduras, Ecuador and Mexico. She then used a statistical technique known as a discriminant analysis to group samples based on similar concentrations of nine organic compounds, including caffeine, a similar compound called theobromine and an antioxidant called epicatechin.
On the American Chemical Society’s SciMeetings online platform in April, Stitzel reported that this chemical fingerprint was enough to accurately identify the correct country of origin for about 90 percent of the samples. In some cases, however, the samples didn’t form neat groups by country. Cocoa liquor samples from Honduras formed two different groups, depending on roasting temperature. Samples in the Honduras group that were roasted at the highest temperature were hard to tell apart from samples from Ecuador and Vietnam.
Stitzel now wants to add more compounds to the analysis to boost her sourcing accuracy and to connect regions to specific flavor compounds. “We’re still … trying to understand which compounds might be related to flavor,” she says. Her recent analysis already shows that caffeine, theobromine and epicatechin, which all produce a bitter flavor, can help set apart one country’s chocolates from another’s.
The aroma of place
Other researchers are finding that terroir leaves an imprint on the molecules that shape food’s aroma. Plants produce compounds known as aroma glycosides, which contain a sugar component linked to a volatile aromatic compound. When intact, aroma glycosides have no scent. But breaking the sugar-volatile bond — via high temperatures, low pH or enzymes from yeast — sets the volatile and its aroma free. The bouquet of a nicely aged bottle of wine is made up, in part, of aroma volatiles in the grapes that yeast enzymes let loose over time.
Many beer brewers, however, would rather your IPA have the same reliable flavor whether you pop open the bottle this Friday or in October. When volatile aromatics let loose in a bottled beer, that’s no good for large-volume brewers who need to ship consistent-tasting products. Brewers call that volatile release “beer creep,” says Paul Matthews, a senior research scientist in the Washington state branch of Hopsteiner, an international commercial hop grower and processor headquartered in New York City.
If brewers add hops (the flower of the hop plant) to beer early in the brewing cycle, heat breaks the sugar-volatile bond and the aroma from aroma glycosides is largely lost before bottling. The remaining flavor is more consistent over time. But when craft brewers make “dry hopped” beers like IPAs, adding the hops after the boiling stage, this late addition allows many aroma glycosides to go into fermentation and then into the bottle intact. The compounds release volatile aromatics as yeast enzymes break bonds even after the bottle is capped. So the aromas of these beers are more likely to “creep” over time.
Because genetics influences aroma and flavor, Matthews is exploring whether it’s possible to better control aroma glycoside concentrations through breeding. Breeding hop varieties to have lower concentrations could diminish the “beer creep” problem faced by large-volume craft brewers who distribute their beer over long distances.
At the same time, Matthews and colleagues are investigating the potential of breeding hop varieties to have higher aroma glycoside concentrations for use by smaller craft brewers, who are less concerned about shelf life but want to enhance the aroma of their beers.
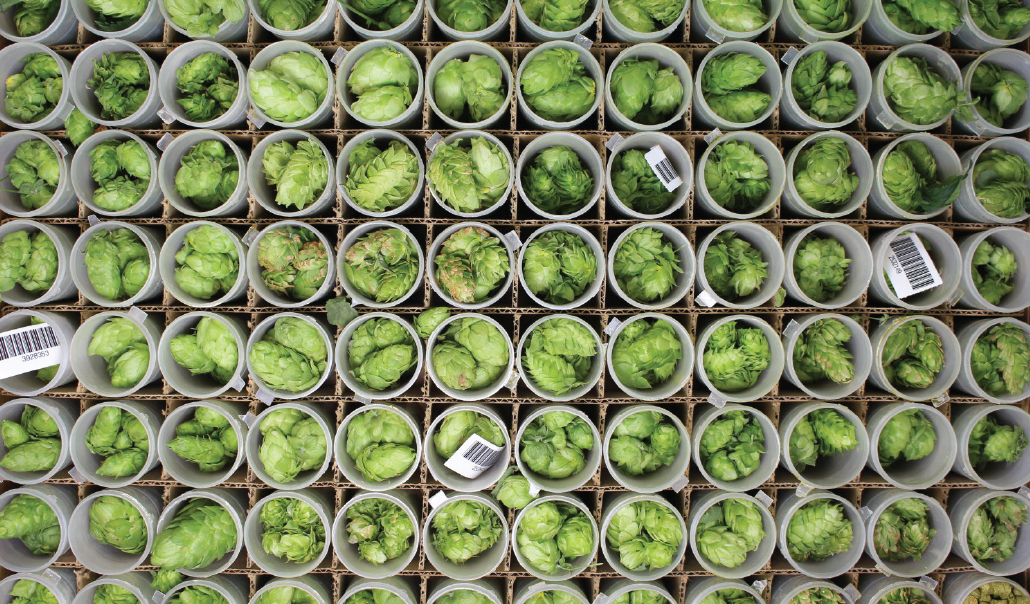
Matthews recently tested whether aroma glycoside concentrations in individual hop cultivars are determined more by genetics or by terroir. “Of course, they are determined by both,” he says. “But if they are more genetic, we can breed for them.”
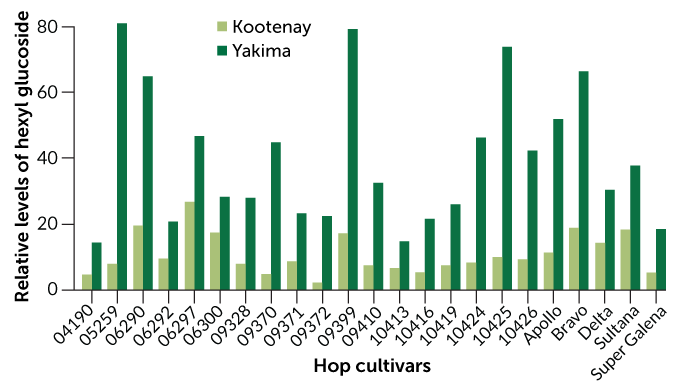
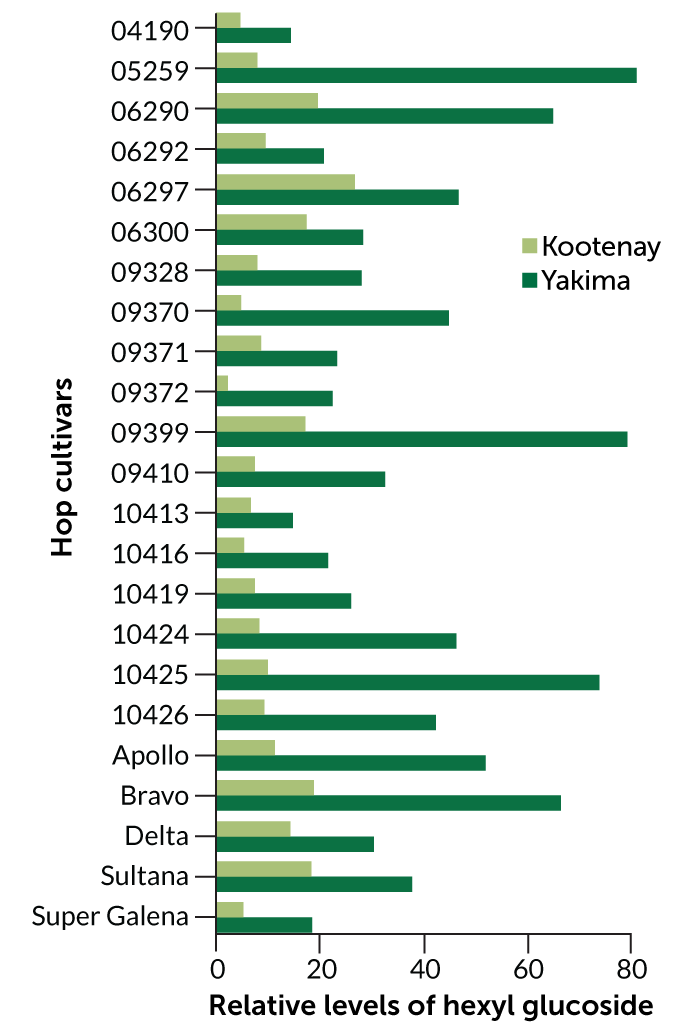
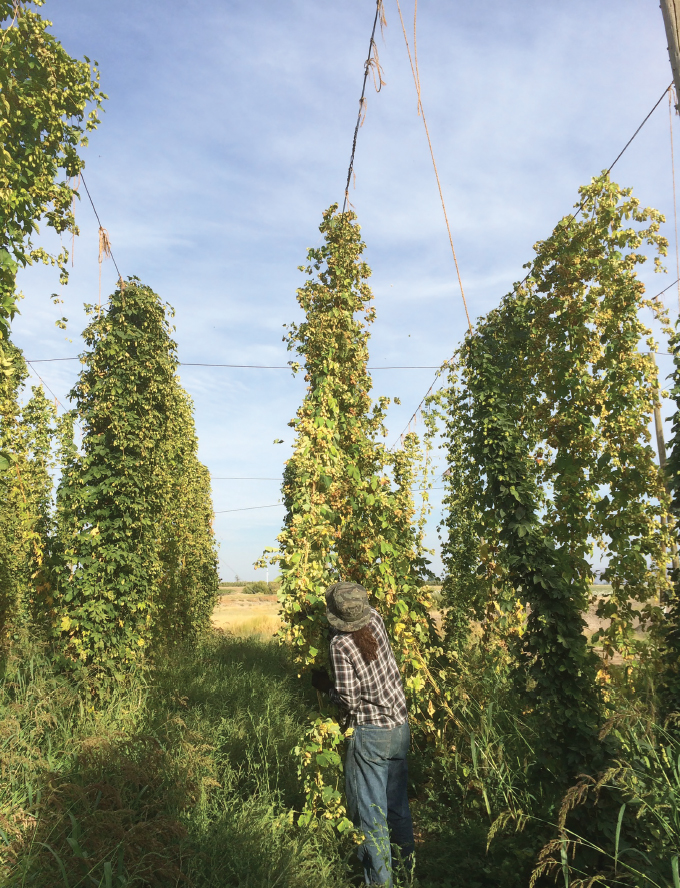
In collaboration with colleagues, including phytochemist Taylan Morcol of Lehman College in the Bronx, part of the City University of New York, Matthews grew the same 23 genetically distinct hop cultivars at two commercial fields with distinct terroirs. Matthews calls the Yakima Valley site in Washington state “desert in the shadow of Mount Rainier.” The other site, in the Kootenay River valley in Idaho, is “much more boreal — pine forest and humid,” he says.
At each location, the team measured the concentrations of four aroma glycosides in each hop cultivar. Genetics indeed played the biggest role in determining how much aroma glycosides a hop plant produces, the researchers report in the Aug. 15 Food Chemistry. The concentrations of three of the aroma glycosides differed across cultivar types but remained fairly similar within the same cultivar grown in the two locations.
But for one aroma glycoside, terroir trumped genes in a big way. At the Kootenay site, all of the cultivars produced low concentrations of hexyl glucoside, a molecule that gives off a grassy aroma when its sugar bond is broken. But at the Yakima site, every one of these same cultivars, with genetics matching the plants in Kootenay, produced about two to eight times as much hexyl glucoside.
“There is a terroir difference,” Matthews says. The team can’t yet pinpoint which component of terroir causes the spike in hexyl glucoside at the Yakima site. The best guess: mites and aphids.
At Yakima, those critters, which munch on the hop plants, hang around for a longer portion of the growing season than at the Kootenay site. Matthews and his colleagues hypothesize that the plants might produce hexyl glucoside chemicals as a defense against the pests. When a mite or aphid munches on the plant, the volatile may be released to attract insects that will eat the mites or aphids.
The researchers are planning a follow-up experiment to test whether hop plants exposed to these pests in environmentally controlled chambers produce more of this grassy hexyl glucoside than hop grown under the same environmentally controlled conditions without the pests.
Microbes leave their mark
People have understood the importance of yeast in wine fermentation for at least two centuries. About six years ago, food microbiologist David Mills of the University of California, Davis and graduate student Nicholas Bokulich, now a food microbiologist at ETH Zurich, discovered that groups of microbes may help shape the flavor of wine. Unique microbial communities in different California growing regions can predict which metabolites will be present in the finished wine, Mills, Bokulich and colleagues reported in 2016 in mBio. “Metabolites are any product of metabolism in any organism,” Bokulich says, adding that yeast, other fungi and bacteria each make varying contributions of metabolites in different wines.
“Those metabolites … have an aroma and a flavor,” says Kate Howell, a biochemist at the University of Melbourne in Australia. One of Howell’s own studies, she and her team reported online in August in mSphere, suggests that fungal species in particular shape the metabolites — and thus aroma and flavor — in wine from different growing regions in Australia.
Howell and colleagues studied microbes at 15 vineyards growing Pinot Noir grapes across six wine regions in southern Australia. At each vineyard, the team extracted fungal and bacterial DNA from the soil, as well as from what’s known as the “must” — destemmed, crushed grapes that haven’t yet been fermented. Then, the team identified 88 metabolites in the finished wine.
Different wine growing regions had distinct microbial communities in both the soil and the must, which appeared to influence the unique compositions of metabolites in the finished wine. The researchers found that over 80 percent of the metabolites found in the various wines were linked to the diversity of fungi found in the grape must. High levels of Penicillium fungi, for example, resulted in wine with low levels of octanoic acid, a volatile compound that can give wine a mushroom flavor.
Howell hopes vintners may someday be able to manage microbes in the soil and throughout the fermentation process to bring out the best of the local microbial terroir. Today, nearly all of the yeasts that vintners purchase to add to their grape must are isolated from French vineyards and other famous wine regions, she says. “That doesn’t present the same value of place as encouraging diversity in the fermentation in the place that the grapes were grown.”
For his part, Quinn, of The Red Hen, eagerly awaits more scientific explorations of terroir. He would especially like to know why wines produced from the limestone-dominated Kimmeridgian soils in Chablis, Sancerre and Champagne, France, all have a chalky, saltlike mineral taste. Scientific research helps explain how wine reflects its place, Quinn says, “from the climatic elements to the microbial elements, what the earth is saying, and why [a particular] wine is so delicious.”
New maps show how warm water may reach Thwaites Glacier’s icy underbelly
New seafloor maps reveal the first clear view of a system of channels that may be helping to hasten the demise of West Antarctica’s vulnerable Thwaites Glacier. The channels are deeper and more complex than previously thought, and may be funneling warm ocean water all the way to the underside of the glacier, melting it from below, the researchers found.
Scientists estimate that meltwater from Florida-sized Thwaites Glacier is currently responsible for about 4 percent of global sea level rise (SN: 1/7/20). A complete collapse of the glacier, which some researchers estimate could happen within the next few decades, could increase sea levels by about 65 centimeters. How and when that collapse might occur is the subject of a five-year international collaborative research effort.
Glaciers like Thwaites are held back from sliding seaward both by buttressing ice shelves — tongues of floating ice that jut out into the sea — and by the shape of the seafloor itself, which can help pin the glacier’s ice in place (SN: 4/3/18). But in two new studies, published online September 9 in The Cryosphere, the researchers show how the relatively warm ocean waters may have a pathway straight to the glacier’s underbelly.
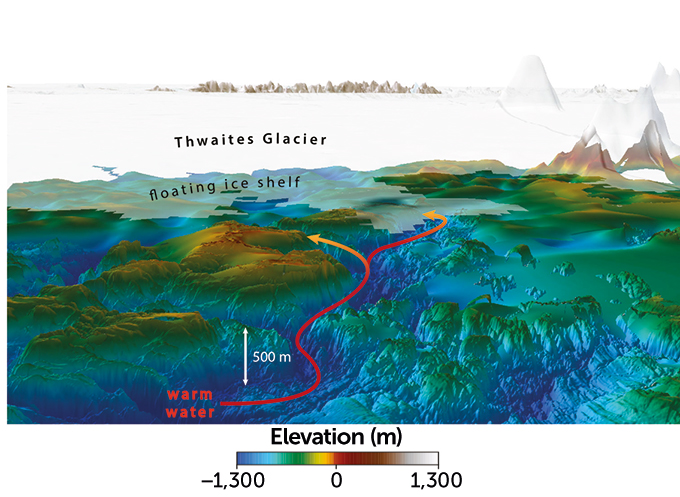
From January to March 2019 researchers used a variety of airborne and ship-based methods — including radar, sonar and gravity measurements — to examine the seafloor around the glacier and two neighboring ice shelves. From those data, the team was able to estimate how the seafloor is shaped beneath the ice itself.
These efforts revealed a rugged series of high ridges and deep troughs on the seafloor, varying between about 250 meters and 1,000 meters deep. In particular, one major channel, more than 800 meters deep, could be funneling warm water all the way from Pine Island Bay to the submerged edge of the glacier, the team found.


