Category: Uncategorized
Could delaying a second vaccine dose lead to more dangerous coronavirus strains?
Spiking COVID-19 cases, slow vaccine rollout and the emergence of more transmissible coronavirus variants in some countries have sparked debate among scientists over the best way to protect people with recently authorized vaccines.
One idea involves delaying when people receive the second of two required vaccine doses, so that more people can receive the doses that are currently available.
That’s happening in the United Kingdom, where researchers have raised concerns about a new coronavirus variant that appears to be more contagious than other versions. Officials there are opting to extend the time between each vaccine dose from three or four weeks to up to three months (SN: 12/22/20).
In the United States, on the other hand, officials strongly recommend that states stick to the regimen that the U.S. Food and Drug Administration authorized in December — two shots spaced three weeks apart for Pfizer-BioNTech’s vaccine and four weeks apart for Moderna’s.
On January 12, the Trump administration announced it was no longer holding back second shots of COVID-19 vaccines, several days after President-elect Joe Biden suggested he would release all the shots. While that may speed protection for more Americans, it also raises the possibility that people might not get their second doses on time, if manufacturing problems arise.
The possibility that second doses could be delayed has some experts concerned because it might lead to millions of people walking around with only partial immunity to the coronavirus, a condition that could be ripe for harmful mutations of the virus to arise.
Delaying the second shot is a gamble, says Ramón Lorenzo-Redondo, a virologist at Northwestern University Feinberg School of Medicine in Chicago, particularly without a lot of evidence suggesting how well one dose works. Officials “shouldn’t gamble [their] best tools” to fight the pandemic, he says. “We don’t want to fuel [potential viral evolution] by doing suboptimal immunization of the population.”
How that fueling of virus evolution could happen comes down to the immune system. If people have full immunity as a result of vaccination, their immune response is likely to be robust, spawning large numbers of neutralizing antibodies, for example, that stop viruses from getting into cells and heading off harmful mutations before they arise. But if people have partial immunity, that immune response is likely to be weaker.
It’s like when doctors encourage patients to finish a full course of antibiotics, Lorenzo-Redondo says. In that case, eliminating susceptible bacteria with a full course could help lower the chance that stragglers build up resistance.
For the COVID-19 vaccine, if people’s second doses are delayed long enough — akin to not finishing a full complement of antibiotics — it’s possible that low numbers of neutralizing antibodies triggered by only one dose may only partially fight an infection. That might provide more time for variants of the virus with immune-dodging mutations to arise and thrive and be transmitted to other people.
If immune-dodging variants do arise as a result of shot delays and spread to lots of people, that could deal a blow to vaccines’ effectiveness. For example, if mutations arose that prevented vaccine-induced antibodies from binding to the virus, or caused antibodies to bind less tightly, that virus variant may be more likely to infect cells than variants without the mutation and thus cause disease, Lorenzo-Redondo says. With cases surging in many places, including the United Kingdom and the United States, the coronavirus could have even more chances to accumulate vaccine-evading mutations than it would if case numbers were lower.
For now, it’s unclear how protected vaccinated people are after a single shot and for how long. Trial participants who received Pfizer-BioNTech’s vaccine had low levels of neutralizing antibodies 21 days after the first dose, researchers reported in the Dec. 17 New England Journal of Medicine. But clinical trial results from both the Pfizer-BioNTech and Moderna vaccines suggest that protection begins around two weeks after the first dose — Pfizer-BioNTech’s vaccine had an efficacy of around 50 percent after the first dose and Moderna’s had around 80 percent efficacy (SN: 12/18/20). It’s unknown how durable that protection might be, says Sarah Cobey, an epidemiologist and evolutionary biologist at the University of Chicago, but it would be weird to see it fade quickly.
Cobey is one of the scientists who isn’t worried about the risk of a long delay between shots. Instead, expanding how many people get the first dose could actually help control how much the coronavirus changes, she says. That’s because even the partial protection that people may get from a single dose “will almost certainly lower the prevalence of infection,” she says. Fewer infections overall would mean fewer coronavirus variants in general circulating among people. By virtue of numbers, the coronavirus then may not accumulate as many mutations that could help it evade immune systems.
And even if a virus accumulates mutations that help it dodge the immune response as a result of the dose delay, such changes might in turn damage essential viral functions like breaking into and hijacking a host cell. A virus that can escape immunity, for instance, might end up being less transmissible. For now, it’s unclear what might happen with the coronavirus, which in general mutates more slowly than other similar viruses thanks to a unique proofreading enzyme that acts as a spell-check for the letters that make up the coronavirus’s genetic blueprint (SN: 1/28/20).
What’s more, the immune responses that a person makes also don’t attack just one part of a virus. Antibodies, for instance, including those induced by vaccines, hit many different parts of viral proteins, making it harder for the virus to escape. And over time antibodies can get better at their job (SN: 11/24/20). So, most mutations are unlikely to render antibodies completely ineffective.
“You put that all together and it’s a pretty high barrier” for virus evolution to work around, says Adam Lauring, an infectious disease physician and virologist at the University of Michigan Medical School in Ann Arbor.
In lab experiments, for example, COVID-19 patient serum that harbors myriad coronavirus antibodies still stops the coronavirus from infecting cells in a dish, even if there are viral mutations, researchers reported in a preliminary study posted January 4 at bioRxiv.org. While a few mutations — including one present in a coronavirus variant now circulating in South Africa — made antibodies in the serum less effective at stopping viruses from infecting cells, the serum’s virus-halting activity didn’t outright disappear.
Still, that doesn’t mean potentially risky viral evolution as a result of delaying doses is not going to happen. “I think this is something we need to study and we need to look at for sure,” Lauring says. For now, “I’m not sure we know enough that we can really confidently say what one or other [vaccine-dosing] strategy is going to do.”
Some electric eels coordinate attacks to zap their prey
One Volta’s electric eel — able to subdue small fish with an 860-volt jolt — is scary enough. Now imagine over 100 eels swirling about, unleashing coordinated electric attacks.
Such a sight was assumed to be only the stuff of nightmares, at least for prey. Researchers have long thought that these eels, a type of knifefish, are solitary, nocturnal hunters that use their electric sense to find smaller fish as they sleep (SN: 12/4/14). But in a remote region of the Amazon, groups of over 100 electric eels (Electrophorus voltai) hunt together, corralling thousands of smaller fish together to concentrate, shock and devour the prey, researchers report January 14 in Ecology and Evolution.
“This is hugely unexpected,” says Raimundo Nonato Mendes-Júnior, a biologist at the Chico Mendes Institute for Biodiversity Conservation in Brasilia, Brazil who wasn’t involved in the study. “It goes to show how very, very little we know about how electric eels behave in the wild.”
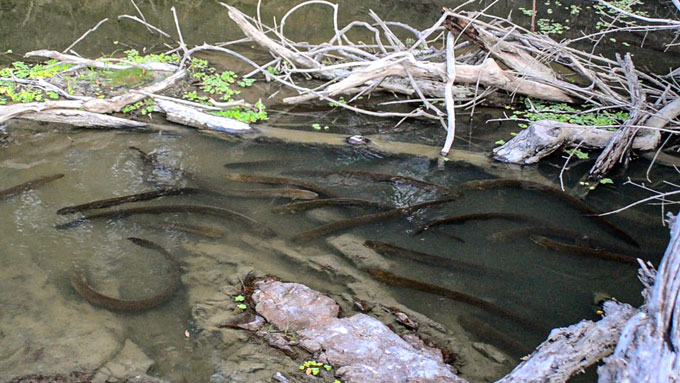
Group hunting is quite rare in fishes, says Carlos David de Santana, an evolutionary biologist at the Smithsonian’s National Museum of Natural History in Washington, D.C. “I’d never even seen more than 12 electric eels together in the field,” he says. That’s why he was stunned in 2012 when his colleague Douglas Bastos, now a biologist at the National Institute of Amazonian Research in Manaus, Brazil, reported seeing more than 100 eels congregating and seemingly hunting together in a small lake in northern Brazil.
Two years later, de Santana’s team returned to the lake to make more detailed observations. The nearly 2-meter-long eels lethargically lay in deeper waters during much of the day, the researchers found. But at dusk and dawn, these long streaks of black come together, swirling in unison to form a writhing circle over 100 strong that herds thousands of smaller fish into shallower waters.
After corralling the prey, smaller groups of about 10 eels unleash coordinated electric attacks that can send shocked fish flying from the water. The researchers haven’t yet measured the combined voltage of such attacks, but 10 Volta’s eels firing together could, in theory, power something like 100 light bulbs, de Santana says. The then helpless, floating prey make easy pickings for the mass of eels. The whole ordeal lasts about two hours.
So far, such aggregations have been observed in only this one lake. But de Santana suspects that group hunting may be advantageous in other lakes and rivers with large shoals of small fish. Much of the eels’ range remains underexplored by scientists, so de Santana and colleagues are launching a citizen science project with Indigenous communities to identify more spots where many eels live together, he explains. “There is still so much we don’t know about these organisms.”
New Combination Drug Therapy Offers Hope Against Methamphetamine Addiction
 DALLAS – Jan. 13, 2021 – A new treatment that combines two existing medications may provide long-sought relief for many battling debilitating methamphetamine use disorder, according to a study to be published tomorrow in The New England Journal of Medicine.
How the groundbreaking theory of plate tectonics was born
Some great ideas shake up the world. For centuries, the outermost layer of Earth was thought to be static, rigid, locked in place. But the theory of plate tectonics has rocked this picture of the planet to its core. Plate tectonics reveals how Earth’s surface is constantly in motion, and how its features — volcanoes, earthquakes, ocean basins and mountains — are intrinsically linked to its hot interior. The planet’s familiar landscapes, we now know, are products of an eons-long cycle in which the planet constantly remakes itself.
When plate tectonics emerged in the 1960s it became a unifying theory, “the first global theory ever to be generally accepted in the entire history of earth science,” writes Harvard University science historian Naomi Oreskes, in the introduction to Plate Tectonics: An Insider’s History of the Modern Theory of the Earth. In 1969, geophysicist J. Tuzo Wilson compared the impact of this intellectual revolution in earth science to Einstein’s general theory of relativity, which had produced a similar upending of thought about the nature of the universe.
Plate tectonics describes how Earth’s entire, 100-kilometer-thick outermost layer, called the lithosphere, is broken into a jigsaw puzzle of plates — slabs of rock bearing both continents and seafloor — that slide atop a hot, slowly swirling inner layer. Moving at rates between 2 and 10 centimeters each year, some plates collide, some diverge and some grind past one another. New seafloor is created at the center of the oceans and lost as plates sink back into the planet’s interior. This cycle gives rise to many of Earth’s geologic wonders, as well as its natural hazards.
“It’s amazing how it tied the pieces together: seafloor spreading, magnetic stripes on the seafloor … where earthquakes form, where mountain ranges form,” says Bradford Foley, a geodynamicist at Penn State. “Pretty much everything falls into place.”
With so many lines of evidence now known, the theory feels obvious, almost inevitable. But the conceptual journey from fixed landmasses to a churning, restless Earth was long and circuitous, punctuated by moments of pure insight and guided by decades of dogged data collection.
Continents adrift
In 1912, German meteorologist Alfred Wegener proposed at a meeting of Frankfurt’s Geological Association that Earth’s landmasses might be on the move. At the time, the prevailing idea held that mountains formed like wrinkles on the planet as it slowly lost the heat of formation and its surface contracted. Instead, Wegener suggested, mountains form when continents collide as they drift across the planet’s surface. Although now far-flung, the continents were once joined together as a supercontinent Wegener dubbed Pangaea, or “all-Earth.” This would explain why rocks of the same type and age, as well as identical fossils, are found on either side of the Atlantic Ocean, for example.
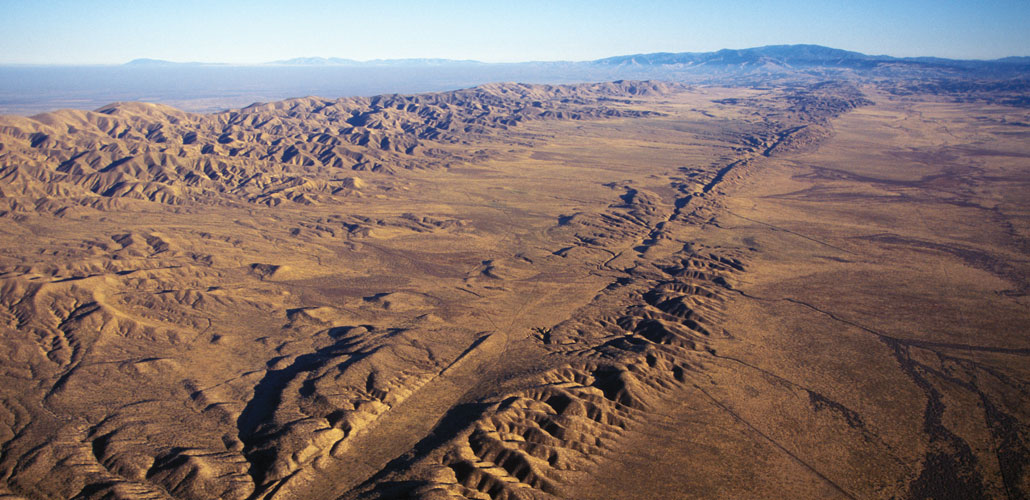

This idea of drifting continents intrigued some scientists. Many others, particularly geologists, were unimpressed, hostile, even horrified. Wegener’s idea, detractors thought, was too speculative, not grounded enough in prevailing geologic principles such as uniformitarianism, which holds that the same slow-moving geologic forces at work on Earth today must also have been at work in the past. The principle was thought to demand that the continents be fixed in place.
German geologist Max Semper disdainfully wrote in 1917 that Wegener’s idea “was established with a superficial use of scientific methods, ignoring the various fields of geology,” adding that he hoped Wegener would turn his attention to other fields of science and leave geology alone.“O holy Saint Florian, protect this house but burn down the others!” he wrote sardonically.
The debate between “mobilists” and “fixists” raged on through the 1920s, picking up steam as it percolated into English-speaking circles. In 1926, at a meeting in New York City of the American Association of Petroleum Geologists, geologist Rollin T. Chamberlin dismissed Wegener’s hypothesis as a mishmash of unrelated observations. The idea, Chamberlin said, “is of the foot-loose type, in that it takes considerable liberty with our globe, and is less bound by restrictions or tied down by awkward, ugly facts than most of its rival theories.”
One of the most persistent sticking points for Wegener’s idea, now called continental drift, was that it couldn’t explain how the continents moved. In 1928, English geologist Arthur Holmes came up with a potential explanation for that movement. He proposed that the continents might be floating like rafts atop a layer of viscous, partially molten rocks deep inside Earth. Heat from the decay of radioactive materials, he suggested, sets this layer to a slow boil, creating large circulating currents within the molten rock that in turn slowly shift the continents about.
Holmes admitted he had no data to back up the idea, and the geology community remained largely unconvinced of continental drift. Geologists turned to other matters, such as developing a magnitude scale for earthquake strength and devising a method to precisely date organic materials using the radioactive form of carbon, carbon-14.
Data flood in
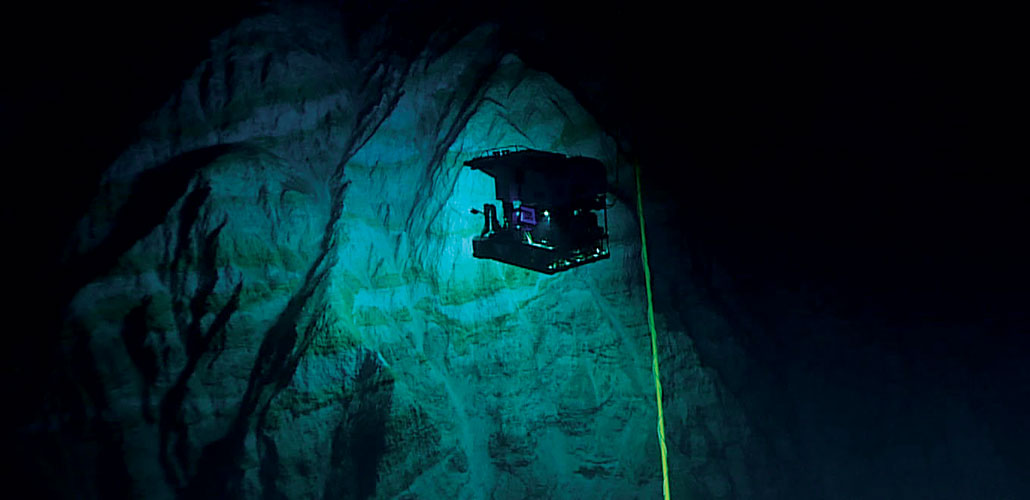
Rekindled interest in continental drift came in the 1950s from evidence from an unexpected source — the bottom of the oceans. World War II had brought the rapid development of submarines and sonar, and scientists soon put the new technologies to work studying the seafloor. Using sonar, which pings the seafloor with sound waves and listens for a return pulse, researchers mapped out the extent of a continuous and branching underwater mountain chain with a long crack running right down its center. This worldwide rift system snakes for over 72,000 kilometers around the globe, cutting through the centers of the world’s oceans.
Armed with magnetometers for measuring magnetic fields, researchers also mapped out the magnetic orientation of seafloor rocks — how their iron-bearing minerals are oriented relative to Earth’s field. Teams discovered that the seafloor rocks have a peculiar “zebra stripe” pattern: Bands of normal polarity, whose magnetic orientation corresponds to Earth’s current magnetic field, alternate with bands of reversed polarity. This finding suggests that each of the bands formed at different times.
Meanwhile, growing support for the detection and banning of underground nuclear testing also created an opportunity for seismologists: the chance to create a global, standardized network of seismograph stations. By the end of the 1960s, about 120 different stations were installed in 60 different countries, from the mountains of Ethiopia’s Addis Ababa to the halls of Georgetown University in Washington, D.C., to the frozen South Pole. Thanks to the resulting flood of high-quality seismic data, scientists discovered and mapped rumbles along the mid-ocean rift system, now called mid-ocean ridges, and beneath the trenches. The quakes near very deep ocean trenches were particularly curious: They originated much deeper underground than scientists had thought possible. And the ridges were very hot compared with the surrounding seafloor, scientists learned by using thin steel probes inserted into cores drilled from shipboard into the seafloor.
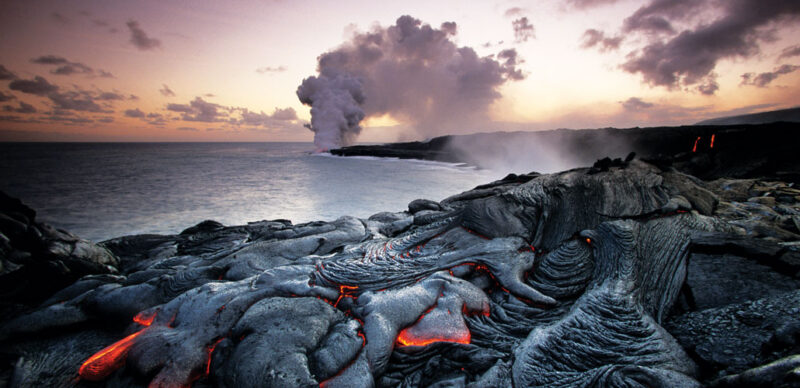
In the early 1960s, two researchers working independently, geologist Harry Hess and geophysicist Robert S. Dietz, put the disparate clues together — and added in Holmes’ old idea of an underlying layer of circulating currents within the hot rock. The mid-ocean ridges, each asserted, might be where circulation pushes hot rock toward the surface. The powerful forces drive pieces of Earth’s lithosphere apart. Into the gap, lava burbles up — and new seafloor is born. As the pieces of lithosphere move apart, new seafloor continues to form between them, called “seafloor spreading.”
The momentum culminated in a two-day gathering of perhaps just 100 earth scientists in 1966, held at the Goddard Institute for Space Studies in New York. “It was quite clear, at this conference in New York, that everything was going to change,” University of Cambridge geophysicist Dan McKenzie told the Geological Society of London in 2017 in a reflection on the meeting.
But going in, “no one had any idea” that this meeting would become a pivotal moment for the earth sciences, says seismologist Lynn Sykes of Columbia University. Sykes, then a newly minted Ph.D., was one of the invitees; he had just discovered a distinct pattern in the earthquakes at mid-ocean ridges. This pattern showed that the seafloor on either side of the ridges was pulling apart, a pivotal piece of evidence for plate tectonics.
At the meeting, talk after talk piled data on top of data to support seafloor spreading, including Sykes’ earthquake data and those symmetrical patterns of zebra stripes. It soon became clear that these findings were building toward one unified narrative: Mid-ocean ridges were the birthplaces of new seafloor, and deep ocean trenches were graves where old lithosphere was reabsorbed into the interior. This cycle of birth and death had opened and closed the oceans over and over again, bringing the continents together and then splitting them apart.
The evidence was overwhelming, and it was during this conference “that the victory of mobilism was clearly established,” geophysicist Xavier Le Pichon, previously a skeptic of seafloor spreading, wrote in 2001 in his retrospective essay “My conversion to plate tectonics,” included in Oreskes’ book.
Plate tectonics emerges
The whole earth science community became aware of these findings the following spring, at the American Geophysical Union’s annual meeting. Wilson laid out the various lines of evidence for this new view of the world to a much larger audience in Washington, D.C. By then, there was remarkably little pushback from the community, Sykes says: “Right away, they accepted it, which was surprising.”
Scientists now knew that Earth’s seafloor and continents were in motion, and that ridges and trenches marked the edges of large blocks of lithosphere. But how were these blocks moving, all in concert, around the planet? To plot out the choreography of this complex dance, two separate groups seized upon a theorem devised by mathematician Leonhard Euler way back in the 18th century. The theorem showed that a rigid body moves around a sphere as though it is rotating around an axis. McKenzie and geophysicist Robert Parker used this theorem to calculate the dance of the lithospheric blocks — the plates. Unbeknownst to them, geophysicist W. Jason Morgan independently came up with a similar solution.
With this last piece, the unifying theory of plate tectonics was born. The hoary wrangling over continental drift now seemed not only antiquated, but also “a sobering antidote to human self-confidence,” physicist Egon Orowan told Science News in 1970.
People have benefited greatly from this clearer vision of Earth’s workings, including being able to better prepare for earthquakes, tsunamis and volcanoes. Plate tectonics has also shaped new research across the sciences, offering crucial information about how the climate changes and about the evolution of life on Earth.
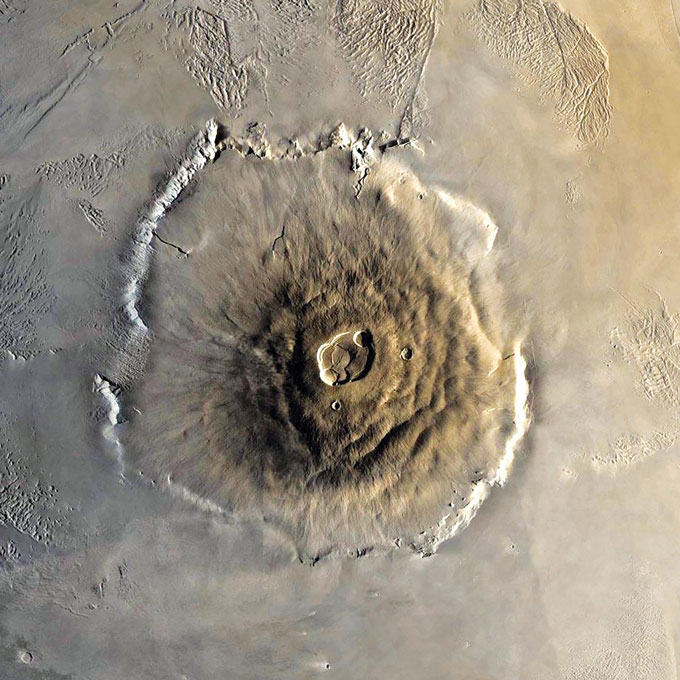
And yet there’s still so much we don’t understand, such as when and how the restless shifting of Earth’s surface began — and when it might end. Equally puzzling is why plate tectonics doesn’t appear to happen elsewhere in the solar system, says Lindy Elkins-Tanton, a planetary scientist at Arizona State University in Tempe. “How can something be a complete intellectual revolution and also inexplicable at the same time?”
Marie Tharp’s groundbreaking maps brought the seafloor to the world
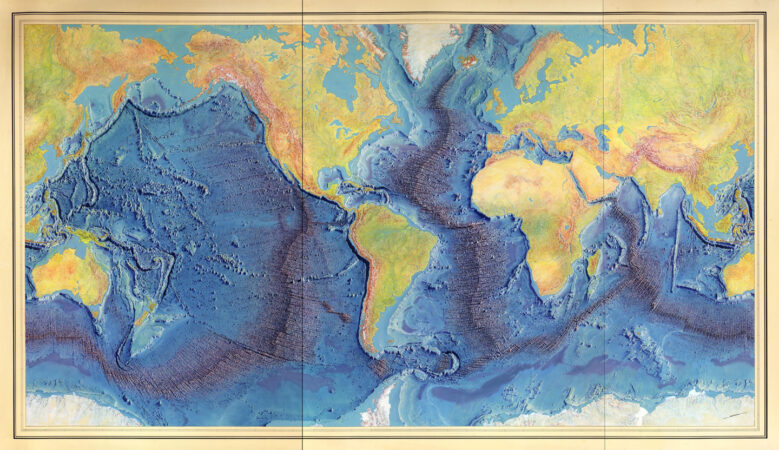
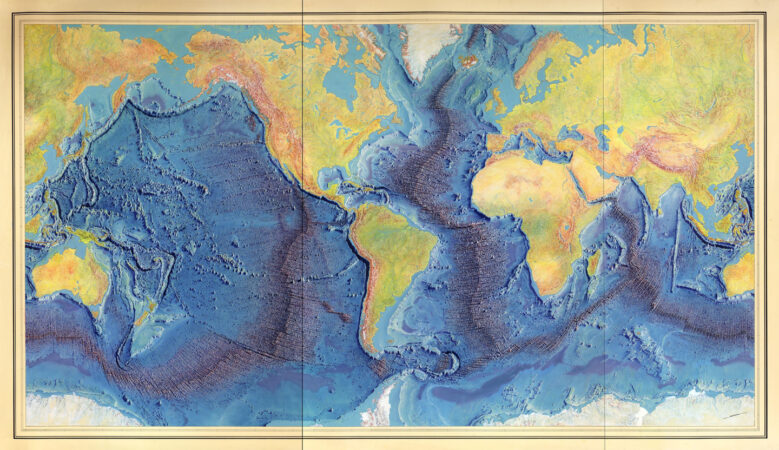
Walk the halls of an academic earth sciences department, and you’ll likely find displayed on a wall somewhere a strikingly beautiful map of the world’s ocean floors. Completed in 1977, the map represents the culmination of the unlikely, and underappreciated, career of Marie Tharp. Her three decades of work as a geologist and cartographer at Columbia University gave scientists and the public alike their first glimpse of what the seafloor looks like.
In the middle of the 20th century, when many American scientists were in revolt against continental drift — the controversial idea that the continents are not fixed in place — Tharp’s groundbreaking maps helped tilt the scientific view toward acceptance and clear a path for the emerging theory of plate tectonics.
Tharp was the right person in the right place at the right time to make the first detailed maps of the seafloor. Specifically, she was the right woman. Her gender meant certain professional avenues were essentially off-limits. But she was able to take advantage of doors cracked open by historical circumstances, becoming uniquely qualified to make significant contributions to both science and cartography. Without her, the maps may never have come to be.
“It was a once-in-a-lifetime — a once-in-the-history-of-the-world — opportunity for anyone, but especially for a woman in the 1940s,” Tharp recalled in a 1999 perspective. “The nature of the times, the state of the science, and events large and small, logical and illogical, combined to make it all happen.”
Tharp’s cartographic roots ran deep. She was born in Michigan in 1920 and as a young girl would accompany her father on field trips to survey land and make maps for the U.S. Department of Agriculture’s Bureau of Soils, a job that kept the family on the move. “By the time I finished high school I had attended nearly two dozen schools and I had seen a lot of different landscapes,” Tharp recalled. “I guess I had map-making in my blood, though I hadn’t planned to follow in my father’s footsteps.”
Tharp was a student at the University of Ohio in 1941 when the attack on Pearl Harbor emptied campuses of young men, who were joining the military in droves. This sudden scarcity of male students prompted the University of Michigan’s geology department to open its doors to women. Tharp had taken a couple of geology classes and jumped at the opportunity. “There were 10 or 12 of us that appeared from all over the United States, girls. With a sense of adventure,” she recalled in an oral history interview in 1994. Tharp earned a master’s degree in 1943, completing a summer field course in geologic mapping and working as a part-time draftsperson for the U.S. Geological Survey along the way. Upon graduating she took a job with an oil company in Oklahoma but was bored by work that involved neither fieldwork nor research. So she enrolled in night classes to earn a second master’s degree in mathematics from the University of Tulsa.
Looking for more excitement, she moved to New York City in 1948. When she walked into the Columbia University geology department looking for a job, her advanced degrees got her an interview, but the only position available to a woman was that of a draftsperson assisting male graduate students working toward a degree in geology that she had already earned. Still, it seemed more promising than the other job she had inquired about — studying fossils at the American Museum of Natural History — so she took it.
The following year Tharp became one of the first women employed by Columbia’s newly founded Lamont Geological Observatory and soon was working exclusively with geologist Bruce Heezen, a newly minted Ph.D. Like many of the male scientists at Lamont, Heezen was primarily occupied with collecting ocean data, which Tharp would then analyze, plot and map — work she was more than qualified to do.
“These men considered it glamorous and pleasurable to go to sea, far more so than staying at home to analyze [the data],” writes science historian Naomi Oreskes of Harvard University in her forthcoming book Science on a Mission: How Military Funding Shaped What We Do and Don’t Know About the Ocean. “This is one reason data analysis was often left to women.” In fact, women often weren’t allowed on the research ships at all.
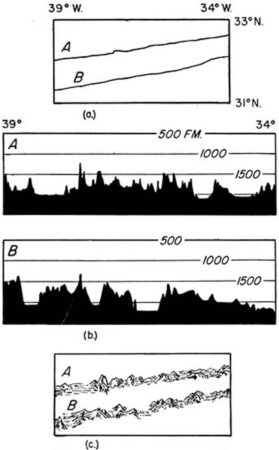
Barred from ocean expeditions, Tharp poured all of her energy into mapping the seafloor starting with the North Atlantic, work that would lead to two important discoveries. To make a map, she first translated the echo soundings gathered by ships crossing the ocean into depths and then created two-dimensional vertical slices of the terrain beneath the ships’ tracks. These ocean-floor profiles showed a broad ridge running down the middle of the Atlantic. Though the feature had been roughly mapped in the 19th century, Tharp noticed a notch near the top of the ridge in each of the profiles. She believed the notches represented a continuous, deep valley running down the center of the mid-ocean ridge. If she was right, the valley might be a rift where molten material came up from below, forming new crust and pushing the ocean floor apart — evidence that could support continental drift.
The idea that the continents were not fixed in place had gained traction in Europe, but Heezen, like most U.S. scientists at the time, “considered it to be almost a form of scientific heresy,” Tharp later wrote in Natural History magazine. It took her a year or so to convince Heezen that the rift was real, and it took the two several more years to finish their first map of the North Atlantic in 1957.
In order to publish that first map and share their work with other scientists, Tharp and Heezen had to get around the U.S. Navy’s Cold War–inspired decision to classify detailed topographic maps that used contour lines to indicate depths. This was one of the reasons the pair chose to adapt a relatively new cartographic style known as a physiographic diagram, a sort of three-dimensional sketch of terrain as if seen from an airplane window. To do this, Tharp had to use her training as a geologist and experience with mapping on land — knowledge and skills that a typical research assistant or draftsperson wouldn’t have had.
Physiographic maps had previously been used to represent continental landforms with standardized symbols. Each type of mountain, valley, plain and desert was sketched in a specific way. Tharp and Heezen were the first to use the technique to show what unknown, unseeable terrain might look like. Tharp first sketched a strip of seafloor along each profile, deciphering what type of landform each bump and dip was likely to be. Then she identified patterns to fill in the blank spaces between the profiles.
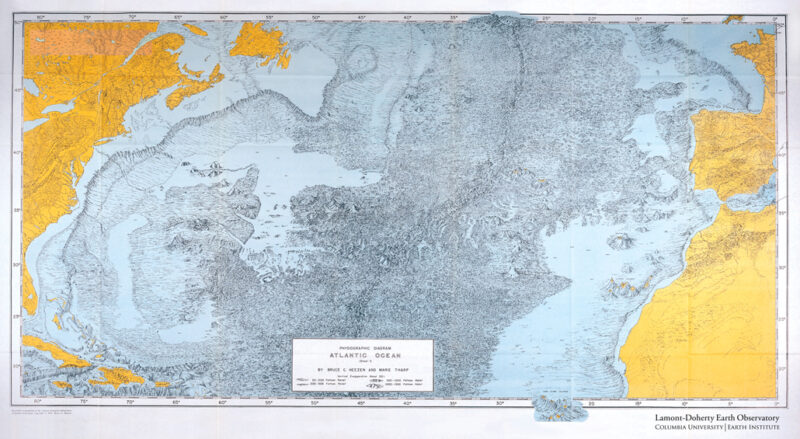
“The amount of work involved in taking it from just from those soundings and being able to create that is just amazing,” says historian Judith Tyner, author of Women in American Cartography.
As Tharp was creating her map, an unrelated project was taking shape on the drafting table next to hers. Heezen had hired a recent art school graduate to plot thousands of earthquake epicenters in the Atlantic Ocean to help Bell Labs find the safest places to lay transoceanic cables. The epicenters he was plotting lined up with Tharp’s rift valley. The correlation lent weight to the idea that the rift was where the crust was pulling apart, and gave Tharp a way to accurately locate the rift between the ship tracks.
Heezen and Tharp’s 1957 diagram of the north Atlantic Ocean was by far the most exhaustive seafloor map ever produced.
“The marvelous thing about that map is how comprehensive it looked on rather limited data,” says science historian Ronald Doel of Florida State University in Tallahassee. “But the earthquake data also helped to make clear just where the ridges are oriented and where the associated geological features are.”
The American scientific community was initially skeptical, wary of the speculative nature of their map. But as the pair continued mapping the rest of the Atlantic and moved on to other oceans, evidence accumulated for a continuous ridge, with a rift valley at its center, stretching for some 60,000 kilometers across the globe.
Tharp and Heezen’s innovative use of the physiographic method gave scientists a compelling visual comparison to continental landforms they understood. This helped convince them that just as the East African Rift was splitting that continent, the submarine rift valley marked where the continents on either side of the Atlantic had pulled away from each other.
“That’s why her map is so powerful,” says historian of geology David Spanagel of Worcester Polytechnic Institute in Worcester, Mass. “It allows people to see the bottom of the ocean as if it were a piece of land, and then reason about it. That’s a transformative thing that she’s able to accomplish.”
National Geographic also took notice of the maps and invited Heezen and Tharp to collaborate on some ocean illustrations with the Austrian painter Heinrich Berann, who would become famous for his mountain panoramas. The gorgeous ocean-floor depictions were included as poster-sized supplements in issues of National Geographic magazine between 1967 and 1971. The magazine had a circulation of 6 million or 7 million at the time, giving a sizable swathe of the public a window into the ocean.
In 1973, Heezen and Tharp received a grant from the U.S. Navy to work with Berann on a complete map of the world’s ocean floors. It took the trio four years to create their iconic cartographic masterpiece, an unparalleled, panoramic visualization that continues to shape how both scientists and the public think about the seafloor.
The map was finished just weeks before Heezen died of a heart attack at age 53, while in a submarine exploring the mid-ocean ridge near Iceland. His death left Tharp without a source of funding and data, essentially ending her remarkable career. It would be decades before her contributions were fully recognized. But unlike many other unsung figures in the history of science, the accolades began rolling in before she died of cancer in 2006. During the last decade of her life, Tharp received prestigious awards from several institutions including Lamont — now known as the Lamont-Doherty Earth Observatory — and the Library of Congress, which named her one of the four greatest cartographers of the 20th century.
“Can you imagine what heights she would have risen to in her profession,” says Tyner, “if she’d been a man?”
Though hers was always the second name, after Heezen’s, on the maps they made, and doesn’t appear at all on many of the papers her work contributed to, Tharp never expressed any regrets about her path. “I thought I was lucky to have a job that was so interesting,” she recalled in 1999. “Establishing the rift valley and the mid-ocean ridge that went all the way around the world for 40,000 miles — that was something important… You can’t find anything bigger than that, at least on this planet.”
Earth’s oceans are storing record-breaking amounts of heat
Pandemic-related shutdowns may have spared Earth’s atmosphere some greenhouse gas emissions last year, but the world continued to warm.
Water temperature measurements from around the globe indicate that the total amount of heat stored in the upper oceans in 2020 was higher than any other year on record dating back to 1955, researchers report online January 13 in Advances in Atmospheric Sciences. Tracking ocean temperature is important because warmer water melts more ice off the edges of Greenland and Antarctica, which raises sea levels (SN: 4/30/20) and supercharges tropical storms (SN: 11/11/20).
Researchers estimated the total heat energy stored in the upper 2,000 meters of Earth’s oceans using temperature data from moored sensors, drifting probes called Argo floats, underwater robots and other instruments (SN: 5/19/10). The team found that upper ocean waters contained 234 sextillion, or 1021, joules more heat energy in 2020 than the annual average from 1981 to 2010. Heat energy storage was up about 20 sextillion joules from 2019 — suggesting that in 2020, Earth’s oceans absorbed about enough heat to boil 1.3 billion kettles of water.
This analysis may overestimate how much the oceans warmed last year, says study coauthor Kevin Trenberth, a climate scientist with the U.S. National Center for Atmospheric Research who is currently based in Auckland, New Zealand. So the researchers also crunched ocean temperature data using a second, more conservative method for estimating total annual ocean heat and found that the jump from 2019 to 2020 could be as low as 1 sextillion joules. That’s still 65 million kettles brought to boil.
The three other warmest years on record for the world’s oceans were 2017, 2018 and 2019. “What we’re seeing here is a variant on the movie Groundhog Day,” says study coauthor Michael Mann, a climate scientist at Penn State. “Groundhog Day has a happy ending. This won’t if we don’t act now to dramatically reduce carbon emissions.”
Rats with poisonous hairdos live surprisingly sociable private lives
Crested rats don’t just chew tree bark that’s poisonous enough to kill an elephant. The rabbit-sized rodents dribble and lick the toxic drool into their long rat fluff for a weaponized hairdo. Yet these dangerous rats, which scientists assumed were loners, turn out to have a close and cuddly family life. They even purr.
Chewing on bark or other parts of East Africa’s arrow poison trees gives the rats toxic saliva to apply to specialized zones of fur. The toxins sink in to porous, easily detached hairs on the rat’s flanks. Any predator foolish enough to bite a Lophiomys imhausi gets a hairy mouthful of bitter toxins that human poachers use on arrows for hunting big game.
The rats “have the personality of something poisonous,” says ecologist Sara Weinstein, who studied them during a Smithsonian fellowship at the Mpala Research Center in Kenya. “They can run quickly if they feel like it, but they don’t typically.” The rats are more likely to jog away from trouble or stand their ground, hissing, growling and grunting.
Trapping crested rats took some experimenting, says ecologist Katrina Nyawira, who worked on the project with Weinstein before moving to Oxford Brookes University in England. “Sometimes we’d set traps for about two weeks and just get one individual and, trust me, that would be a win.”
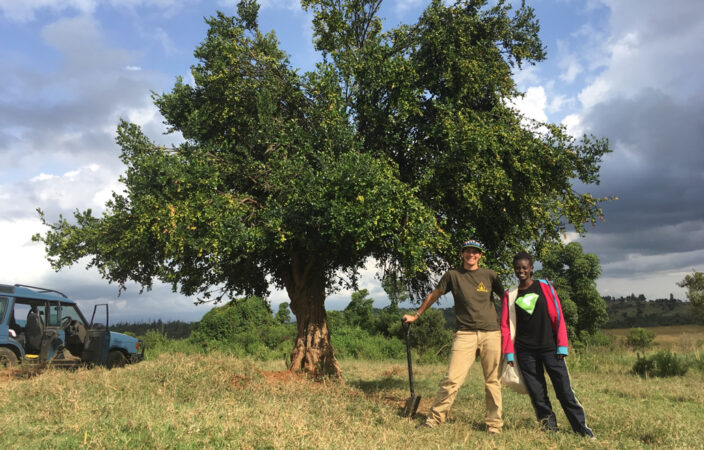
Researchers set traps in a weird variety of locations, from remote spots in the Kenyan savanna to behind somebody’s bedroom door, Nyawira and Weinstein realized that the common success factor was access to arrow poison trees (Acokanthera schimperi).
With glossy, green leaves shaped like fat teardrops, this widespread shade tree is a cousin of the North American milkweeds that give monarch butterfly caterpillars their defensive toxins. From roots to shoots, the arrow poison tree carries potent cardenolides that can give would-be predators a heart attack.
When Weinstein and Nyawira had trapped a crested rat for a few days of video observation, the researchers tucked some shreds of the deadly tree bark and roots in the temporary cages. Cameras occasionally caught a nocturnal rat touching up its poison hairs. Rather than luxuriate in grooming, the animals got the poison-handling over with in 10 minutes.
Weinstein wondered if the 25 animals they caught paid some price for licking toxins: “Do they get sick and have to take a nap to sleep it off?” The videos, however, overall showed no extra naps, no sluggishness or other noticeable changes in behavior after hair care. For crested rats, poison really may be just mousse.
How these rats withstand the stuff is an ongoing mystery, with lots of speculation. This species’ stomach, for instance, has chambers more “like a cow…than your typical pizza rat’s,” says Weinstein, now at the University of Utah in Salt Lake City.
She hadn’t planned to study crested rat home life, but one why-not whim changed that. Weinstein once reset a trap in the same place she had just caught a crested rat. She’d heard that the rats were solitary, so her first catch should have emptied the territory. Yet she quickly caught a second rat in the same spot.
“We put the two rats sort of next to each other,” says Weinstein, “They start purring — this vocalization that we’ve never heard before.”
“They very much looked as if they wanted to be together,” she recalls. One was male, the other female. When Weinstein allowed the rats into the same cage, the two started grooming each other. One began following the other around, and the couple eventually retired to the cage’s private retreat, a nest box.
Over the course of several months, Weinstein and Nyawira eventually caught four more male-female pairs. Two pairs had youngsters, and each family snuggled together when reunited in captivity. In videos, pair members stayed close, spending about half of their waking time within just 15 centimeters of each other, the researchers reported online November 17 in the Journal of Mammalogy.
Videos inside the nest box looked especially cozy. Pairs bundled together in nose-to-tail swathes of fluff “like a big scarf,” Nyawira says. Their hair is “really soft, like cat’s fur.” Or as Weinstein puts it: “They’re super cute.”
Foundation for Opioid Response Efforts (FORE) Establishes Scientific Advisory Council to Advance Initiatives Addressing the Nationwide Opioid Crisis
The Foundation for Opioid Response Efforts (FORE) today announced the establishment of its Scientific Advisory Council to provide program-related guidance to assist the Foundation in addressing the nation’s opioid crisis.
Brown tree snakes use their tails as lassos to climb wide trees
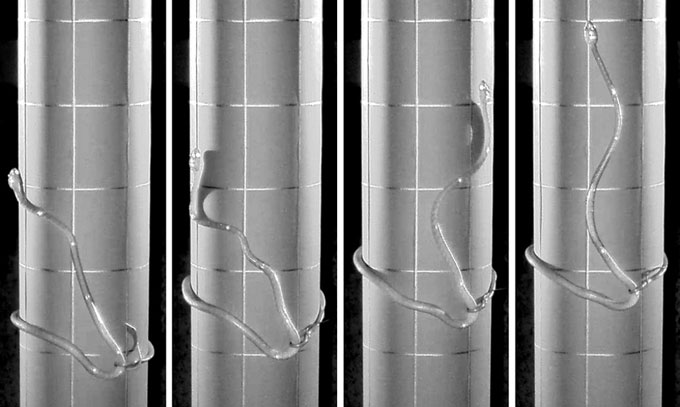
Snakes do a lot more than slither. Some swim, while others sidewind across sand (SN: 10/9/14). Some snakes even fly (SN: 6/29/20). But no one has ever seen a snake move the way that brown tree snakes do when they climb certain trees. By wrapping its tail around a tree or pole in a lasso-like grip and wriggling to propel itself, a brown tree snake can shimmy up structures that would otherwise be too wide to climb.
Better understanding how brown tree snakes (Boiga irregularis) get around could inform strategies to control their population in Guam, where the snakes are an invasive species. The reptiles are infamous for having wiped out almost all of the native forest birds on Guam and frequently cause power outages by clambering up utility poles.
The discovery of brown tree snakes’ lasso climbing method, reported online January 11 in Current Biology, was somewhat serendipitous. Julie Savidge, an ecologist at Colorado State University in Ft. Collins, and colleagues were investigating ways to keep these tree-climbing snakes away from Guam’s Micronesian starlings — one of only two native forest birds left on the island.
One of these ways involved tests to see whether a wide pipe, or baffle, around a pole could prevent predators from reaching a starling nest box at the top. In reviewing hours of footage of the baffle to monitor how well it deterred brown tree snakes, the team saw one snake do something wholly unexpected: The snake lassoed itself around the baffle and began scooting upward.
“We were in total shock,” says study coauthor Thomas Seibert, also an ecologist at Colorado State. “This isn’t something that a snake is supposed to do.”
Brown tree snakes and other snakes typically climb trees that are too smooth to slither up by coiling around a trunk multiple times. A snake wraps the front of its body around the trunk and then coils its back end around the tree in another loop to get a second grip. The snake then stretches its neck up and repeats the process to inch upward. But wrapping around a tree multiple times limits the width of a tree that a snake can scale. Using a single, large, lasso-like grip allows the brown tree snake to climb wider trees — or baffles, explains study coauthor Bruce Jayne, a biologist at the University of Cincinnati in Ohio.
In later lab experiments, the researchers observed several brown tree snakes using this lasso-like posture when placed inside an enclosure with a wide pole topped with a dead mouse for bait. But the lasso climbing method is not very efficient. Five brown tree snakes, ranging from about 1.1 to 1.7 meters long, climbed less than a millimeter per second, on average.
“This was extremely strenuous [for the snakes]. You could see them breathing heavily, and they’d take frequent breaks,” Seibert says. As a result, the snakes probably use the lasso-like motion only on the rare occasions that they encounter trees or poles too wide and smooth to be scaled any other way.
It’s “kind of whacky” to see a snake move like this, says Gregory Byrnes, a biologist at Siena College in Loudonville, N.Y., who was not involved in the work. But Byrnes is not entirely surprised that brown tree snakes have devised a way to deal with wide trees or baffles. These snakes are notoriously agile climbers that can bridge large gaps, slide up steep surfaces and traverse thin wires. “They have so much control over their bodies that if they’re given a challenge … they figure out a way to [overcome] it,” he says.
Testing the limits of brown tree snake agility could help design new baffles or other tools to protect endangered birds on Guam, Savidge says. Already, after the researchers placed several bird boxes on utility poles on the island that were too wide for brown tree snakes to lasso their way up, “the birds adopted these birdhouses and have done very, very well,” she says.
Better understanding snakes’ repertoire of climbing techniques could also make for better robots, says Henry Astley, a biologist at the University of Akron in Ohio who was not involved in the work.
Astley and others are interested in building snakelike robots to navigate terrains that are too difficult for robots with legs or wheels to traverse (SN: 11/16/12). He envisions snake bots slithering through earthquake rubble to search for survivors or wriggling inside large machinery to perform inspections. Discovering new, clever ways in which real snakes exploit their incredible flexibility could help engineers make better use of serpentine machines.


